Excel tutorial pivot tables
Pivot tables — how to add, average, calculate and more in Excel
Pivot tables allow you to quickly add, average and do other calculations on a large series of data in Excel. The spreadsheet used for our instructions contain American League baseball records from 2005 through 2014.
Step 1
- To get started, select "PivotTable" from the pulldown menu as shown below.

Step 2
- In the the box that will appear after selecting PivotTable, select the option to create the pivot table in a new worksheet, and then click OK.
Step 3
- In the new worksheet, drag "team" to the lower left box (row labels) and "W" to the lower right box (Values). This will add all the wins for each team, for the 10 seasons, as shown.

Step 4
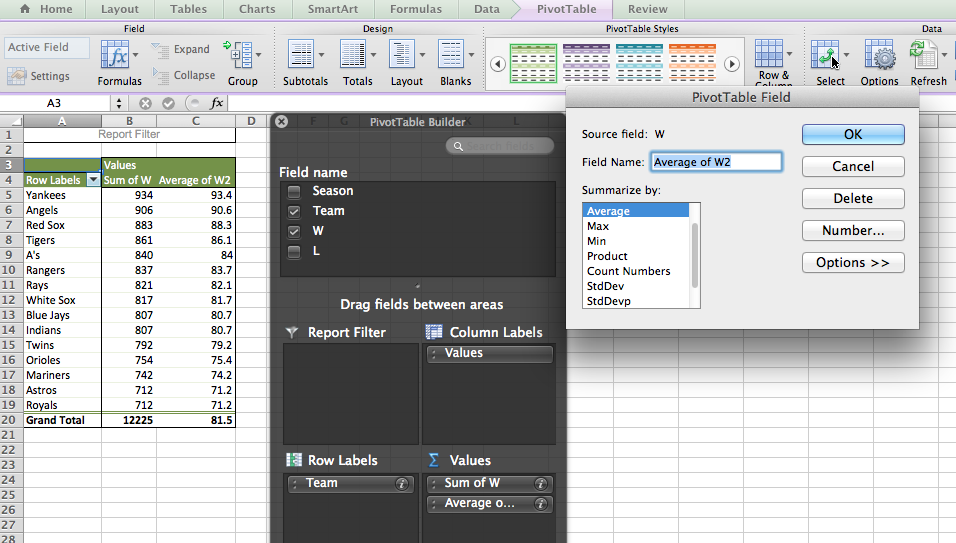
- You can easily add a second calculation. In this case, we want to determine the average number of wins per season for each team.
- Drag the "W" for a second time to the values area in the lower right.
- Click the "i" to display additional options and then select average as shown below.

Step 5
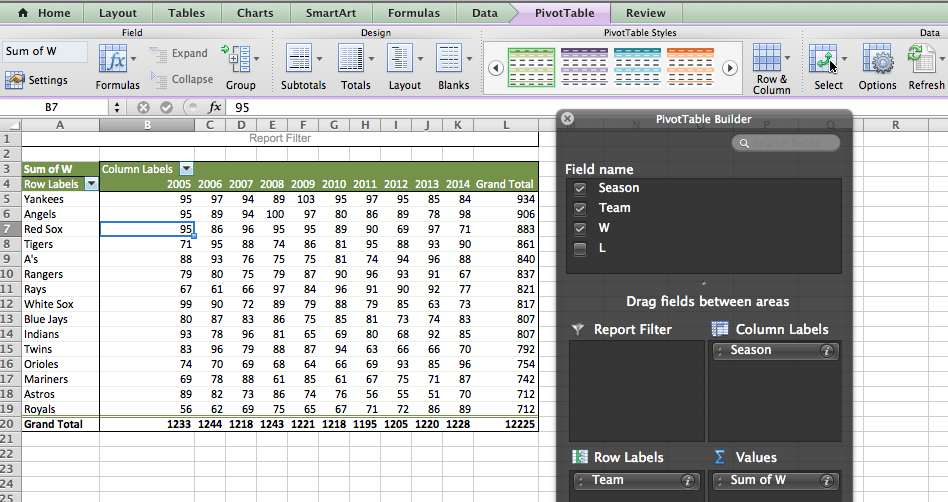
- You may also want to display category results. In this case, we will display the number of wins by season. To keep this example simple, before proceeding, drag the "average" out of the lower right corner of the black PivotTable Builder area to eliminate the averages from the display.
- Drag "Season" into the upper right area (column labels). The result of this action is shown below.

Other useful tips for pivot tables
- If you change your source data in the original tab, you can change the pivot table resultsto match the new source material by "refreshing" the data. Use the "refresh" option shown above, in the upper right of the screenshot above.
- You can easily sort data in pivot table results. To do this, click somewhere in the data a column you want to sort. Then simply click the AZ icon in the tool ribbon at the top of the spreadsheet. One click will sort low to high. A second click will sort high to low.
- Percentages are also often useful. You can do this the same way you pick average, sum or count. In the lower right corner of the PivotTable Builder (values area), click the "i" on an item you have there. Percentage options will not immediately be displayed. Click "options" from the popup box to display more options, including percentages.